- Support Home
- Knowledge Base
- Tracking And Reporting
- Reports
- Generating a mailbox provider report
Generating a mailbox provider report
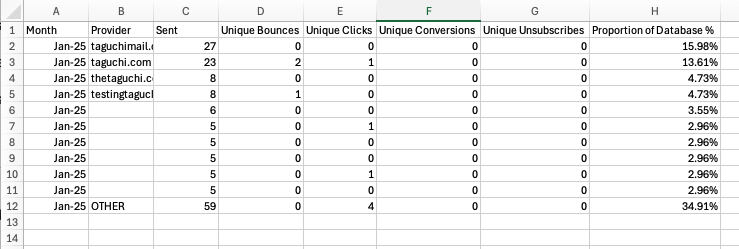
The mailbox provider report provides you with the top 10 email domains used by your subscribers broken down by number of emails sent, unique bounces, clicks, conversions, unsubscribes and the proportion of your database as a percentage.
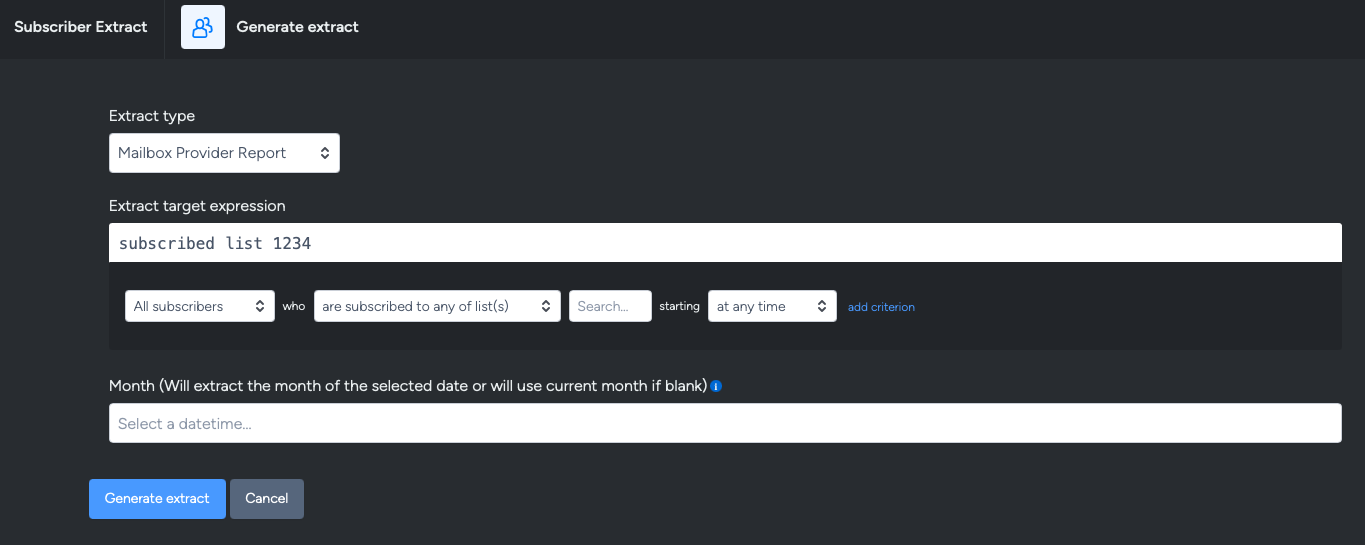
Mailbox reports can be generated within the extract window of any activity, within the 'Extract type' dropdown menu or via Subscribers and the 'Run Extract' button.
Generating and downloading a mailbox report

- A target expression will need to be defined in order to run the report. For example, if you want to run this report on your master list.
- Define a month in which to generate the report. Leaving it blank will select the current month.
Once the report has generated it will be available to download via the Notifications panel. To access this, navigate and click on the 'bell' icon located at the top right side of the Taguchi dashboard.
If the mailbox report has not yet finished, you'll see that it is 'generating', along with scrolling bars moving across its background.
Once completed, you should be able to click on 'download' and receive the mailbox report as a csv file for you to open and review.
Below is a sample of the mailbox provider report:

- Month (of sends)
- Provider (mailbox provider i.e. gmail.com)
- Sent (number sent for that mailbox provider)
- Unique Clicks (unique clicks for that mailbox provider)
- Unique Bounces (unique bounces for that mailbox provider)
- Unique Conversions (unique conversions for that mailbox provider)
- Unique Unsubscribes (unique unsubscribes for that mailbox provider)
- Proportion of Database % (proportion of the database (or subscriber list) that mailbox has)
