- Support Home
- Knowledge Base
- Campaigns And Activities
- AB & Multivariate Testing
- How do I get results of my A/B or Multivariate test?
Related articles
Need some help?
If you have questions or can't find what you're looking for, we're here for you.
Taguchi Support is available Monday to Friday, 9am - 5:30pm AEDT.
Create New TicketTaguchi Certified Training
Join our free and live online training sessions. You'll benefit from a better understanding of the platform's features and functionality. Plus with Taguchi Certified Rewards, every session you attend, you're not just learning - you're earning your way to some fantastic rewards.
About Taguchi Certified RewardsAPI Version 5
Did you know Taguchi has an API that supports all of the functionality provided by the admin interface and more?
Explore API Documentation
Thanks for your feedback!
How do I get results of my A/B or Multivariate test?
You can find the results of your A/B or Multivariate test in the activity results.
- Navigate to the activity tile you'd like to get the results of the A/B or multivariate test
- Click graph button in the middle and it will take you to activity report page
Compare overall optimisation performance
The optimisation performance section will display the performance of each variation and compare the best and worst percentile.
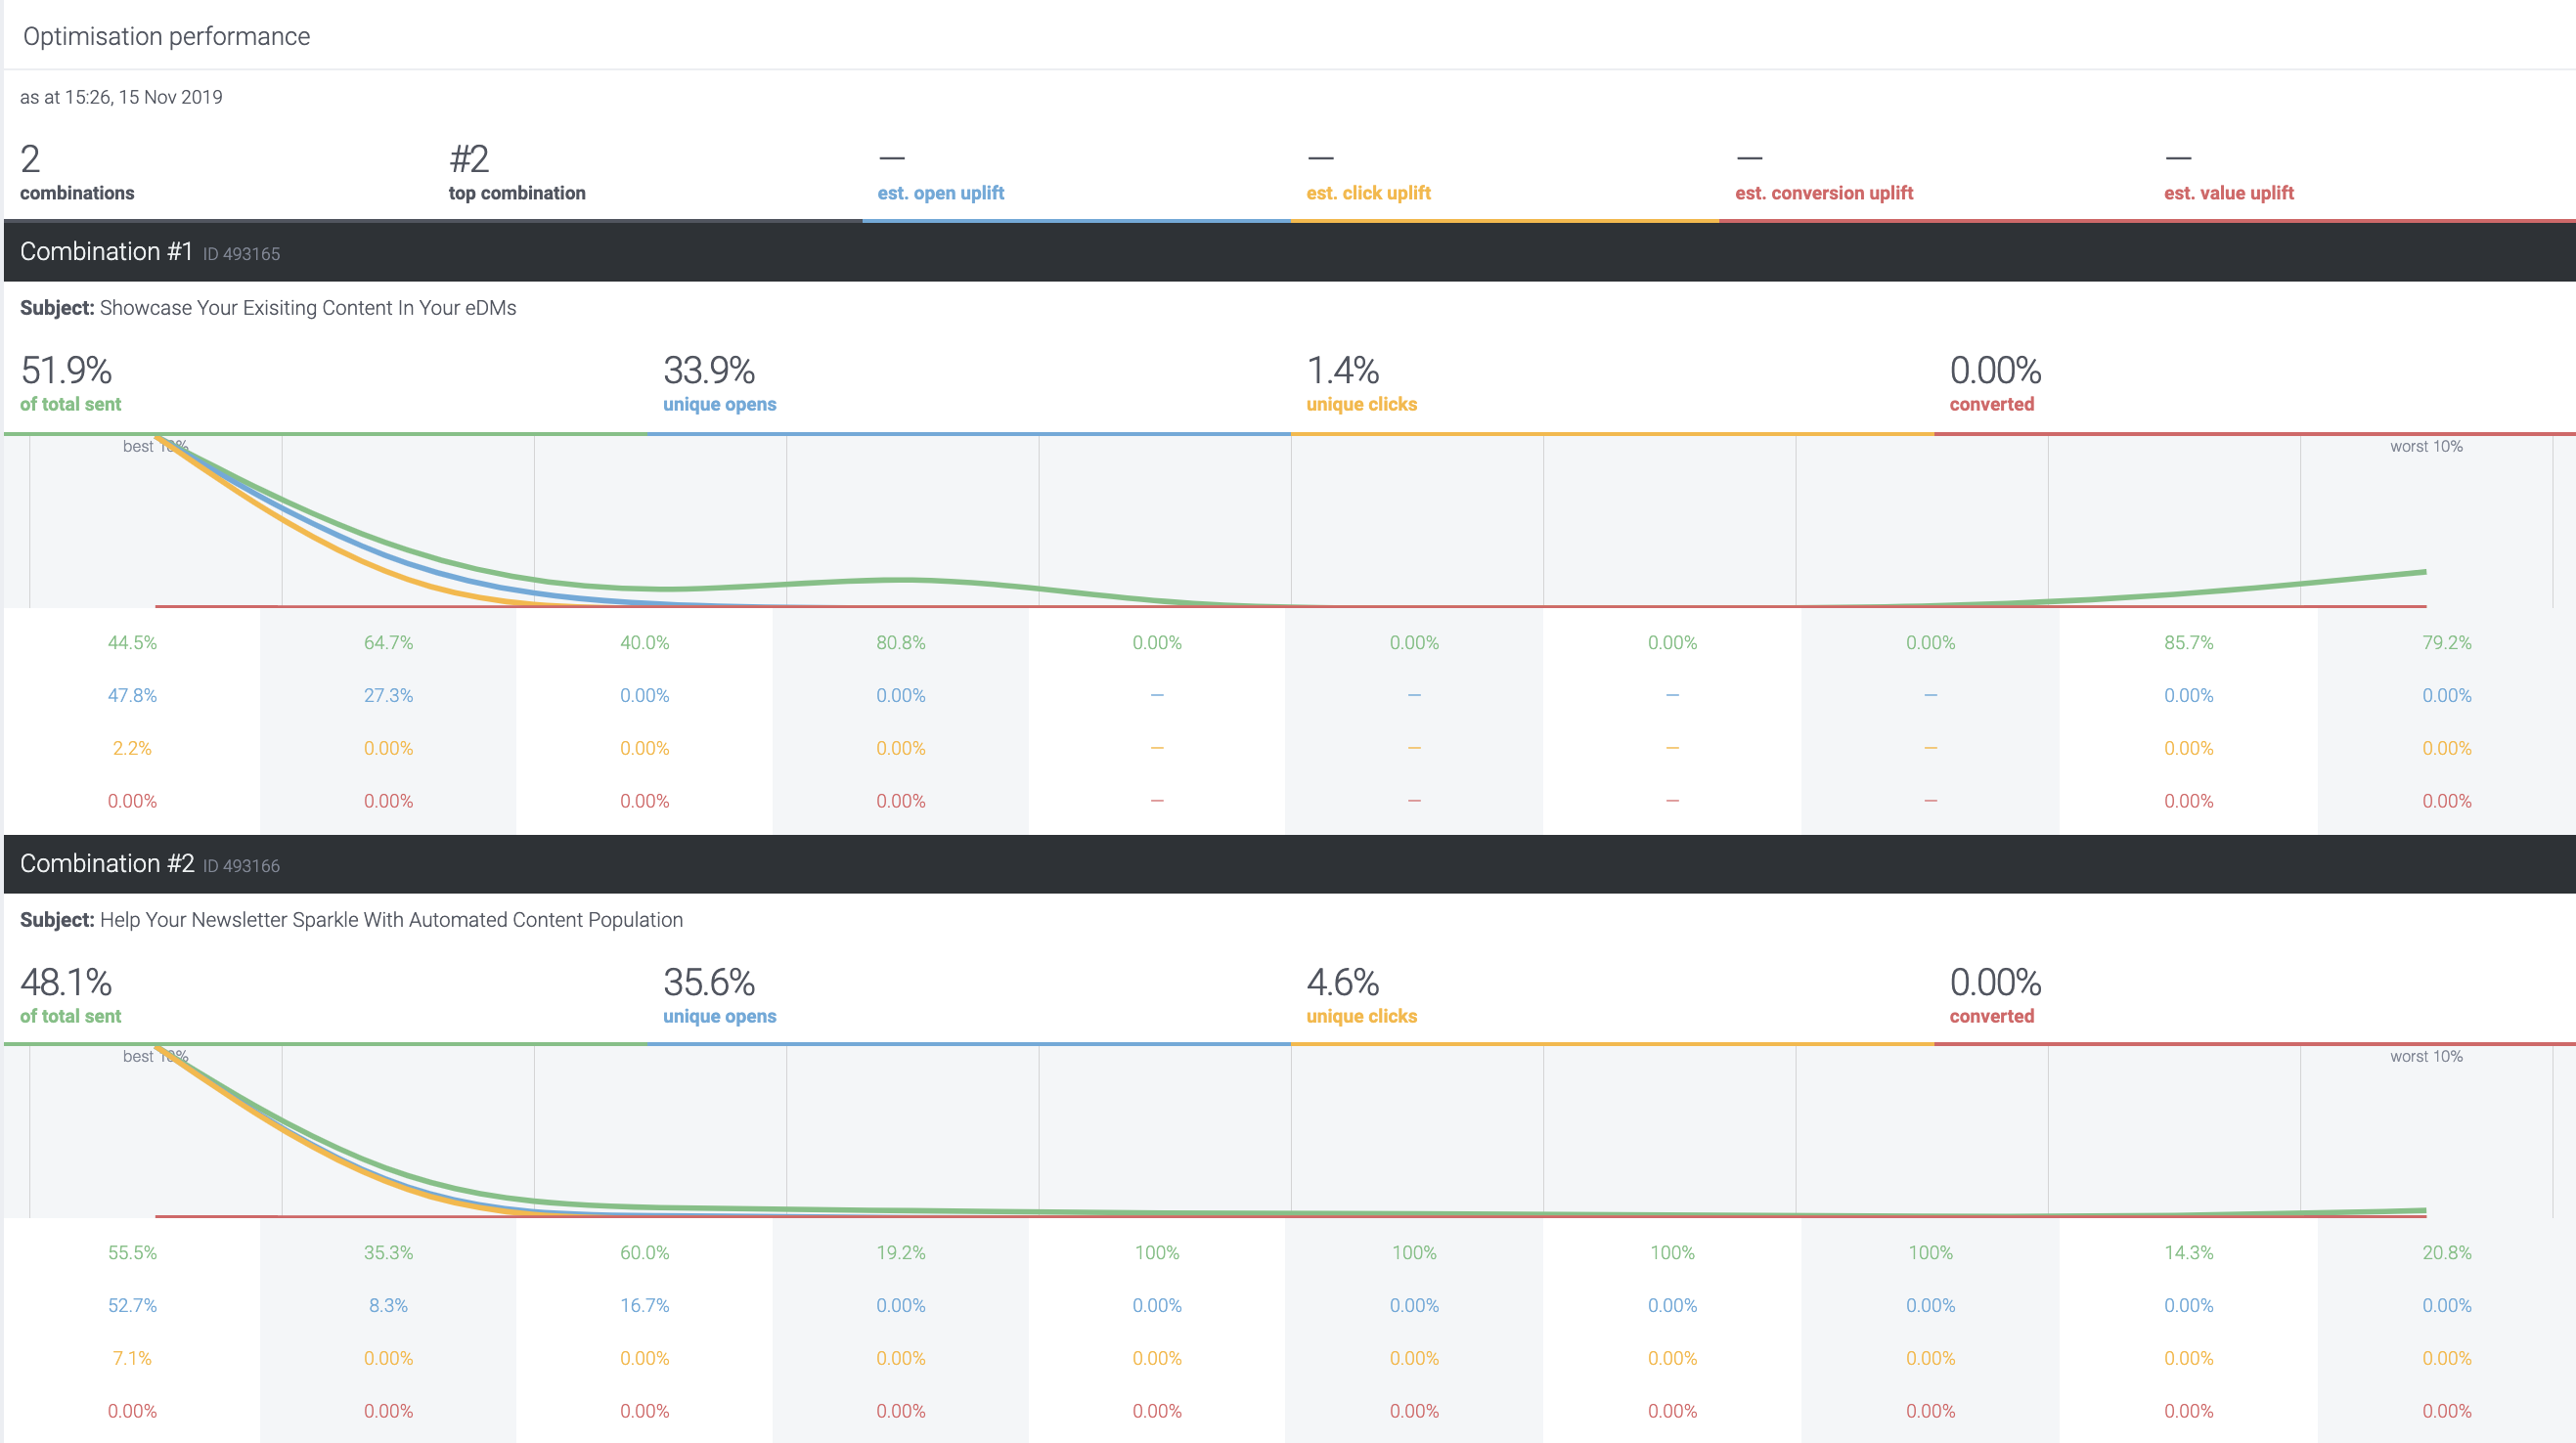
- Combinations : The total number of combinations
- Top combination : The best combination from all the other combinations
- est. open uplift : Estimated uplift in open rate of the best combination
- est. click uplift : Estimated uplift in click rates of the best combination
- est. conversion uplift : Estimated uplift in conversion rates of the best combination
- est. value uplift : Estimated uplift in conversion value of the best combination
The charts at the bottom show how each combination performed across the engagement deciles of those who received it.
Percentiles consist of those who received the full send (or defined combination), split into ten equal percentiles (100% ÷ 10).
The coloured row corresponds to each coloured graph line.
% of total sent : The percentage of total sent.
Unique opens : The percentage of unique opens.
Unique clicks : The percentage of unique clicks.
Converted : The percentage of conversions.
You can also download CSV to see actual numbers of sent, unique opens, unique clicks, conversion and conversion value / send at the bottom of the report.
(Click the "download CSV" link on the top in the activity report)

Compare the effectivity of creative/image with links
If you are testing which images are more effective, you can measure it based on the clicks on the image or creatives.
There is a "Click-through heatmap" section on the bottom of the actiivty report where you can check the clicks of the image in each combinations.
The 'Overlay' dropdown field on the right top allows you to see the numbers and percentage of the total clicks.
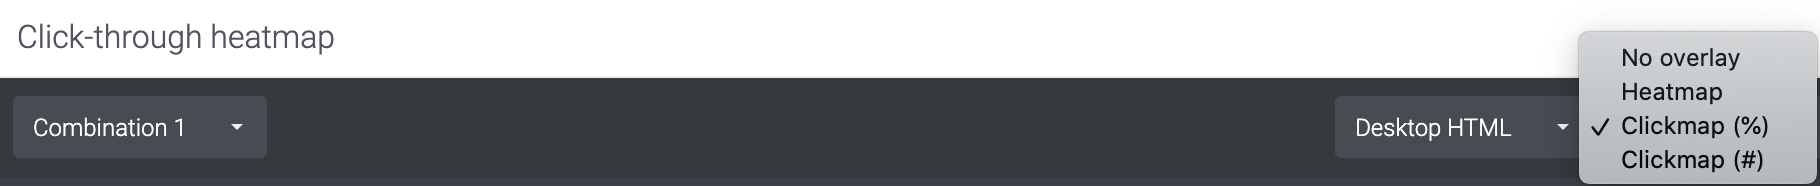
- Clickmap(%) : The percentage of clicks of the creative/image in the combination.
(Number of clicks / total clicks of the combination) * 100 = % of clicks - Clickmap(#) : The number of total clicks of the creative/image in the combination.
You can use the number/percentage of the clicks in each combinations to compare which version worked better.