- Support Home
- Knowledge Base
- Subscriber Management
- Subscriber Profiles
- Identifying Sources of Subscribers
Related articles
Need some help?
If you have questions or can't find what you're looking for, we're here for you.
Taguchi Support is available Monday to Friday, 9am - 5:30pm AEDT.
Create New TicketTaguchi Certified Training
Join our free and live online training sessions. You'll benefit from a better understanding of the platform's features and functionality. Plus with Taguchi Certified Rewards, every session you attend, you're not just learning - you're earning your way to some fantastic rewards.
About Taguchi Certified RewardsAPI Version 5
Did you know Taguchi has an API that supports all of the functionality provided by the admin interface and more?
Explore API Documentation
Thanks for your feedback!
Identifying Sources of Subscribers
Taguchi® provides multiple methods for populating and expanding your subscriber database. These include manual entry, file imports, API-based integrations, and webforms. Each method is suited to different needs, from one-off entries to large-scale data imports.
Bulk import from external files
Subscribers can be imported in bulk using the following supported file formats:
- XLSX (Microsoft Excel)
- CSV (Comma Separated Values)
- TSV (Tab Separated Values)
Note: Each record must contain at least one of the following unique identifiers:
- Email address
- Phone number
- Unique ID
These identifiers are essential as they serve as the primary key for each subscriber record.
To learn how to import bulk subscribers, please refer to our user guide: Importing Bulk Subscribers
Programmatic and custom imports
For high-volume or automated subscriber management, Taguchi offers a Subscriber API that allows:
- Programmatic addition of subscriber data
- Integration with other systems or data sources
- Efficient handling of large datasets (e.g., 150,000+ records)
This method is ideal for continuous synchronization with external platforms or automated workflows.
For more information on programmatic and custom imports, read the user guide here: V5 User Guide: Programmatic and Custom Imports
For small-scale needs, subscribers can be added one at a time directly through the Taguchi platform.
This will launch a popup window with the fields:
- Phone
- External ID
You must populate at least one or more of these fields to add a subscriber. After the subscriber has been added, their profile will automatically load allowing you to edit the standard and custom fields and personalise the subscriber’s list subscription.
Webforms
Taguchi supports the use of webforms to capture subscriber information directly from users. This method is commonly used in:
- Website sign-ups
- Event registrations
- Newsletter subscriptions
- Preference centres
Webforms integrate with the database to add new subscribers in real-time.
By utilising one or a combination of these methods, you can efficiently manage and expand your subscriber database in Taguchi®.
How subscribers are added: Reporting & insights
Reporting options:
- Standard list reports: Show the complete history of the list without date filters.
- Interactive online reports: Use the interactive graph to view data for specific date ranges.
- Custom reports: If you require a tailored report (e.g., unique filters, visualisations, or formats), you can request one by contacting Taguchi® Support. These are subject to scoping and requirements.
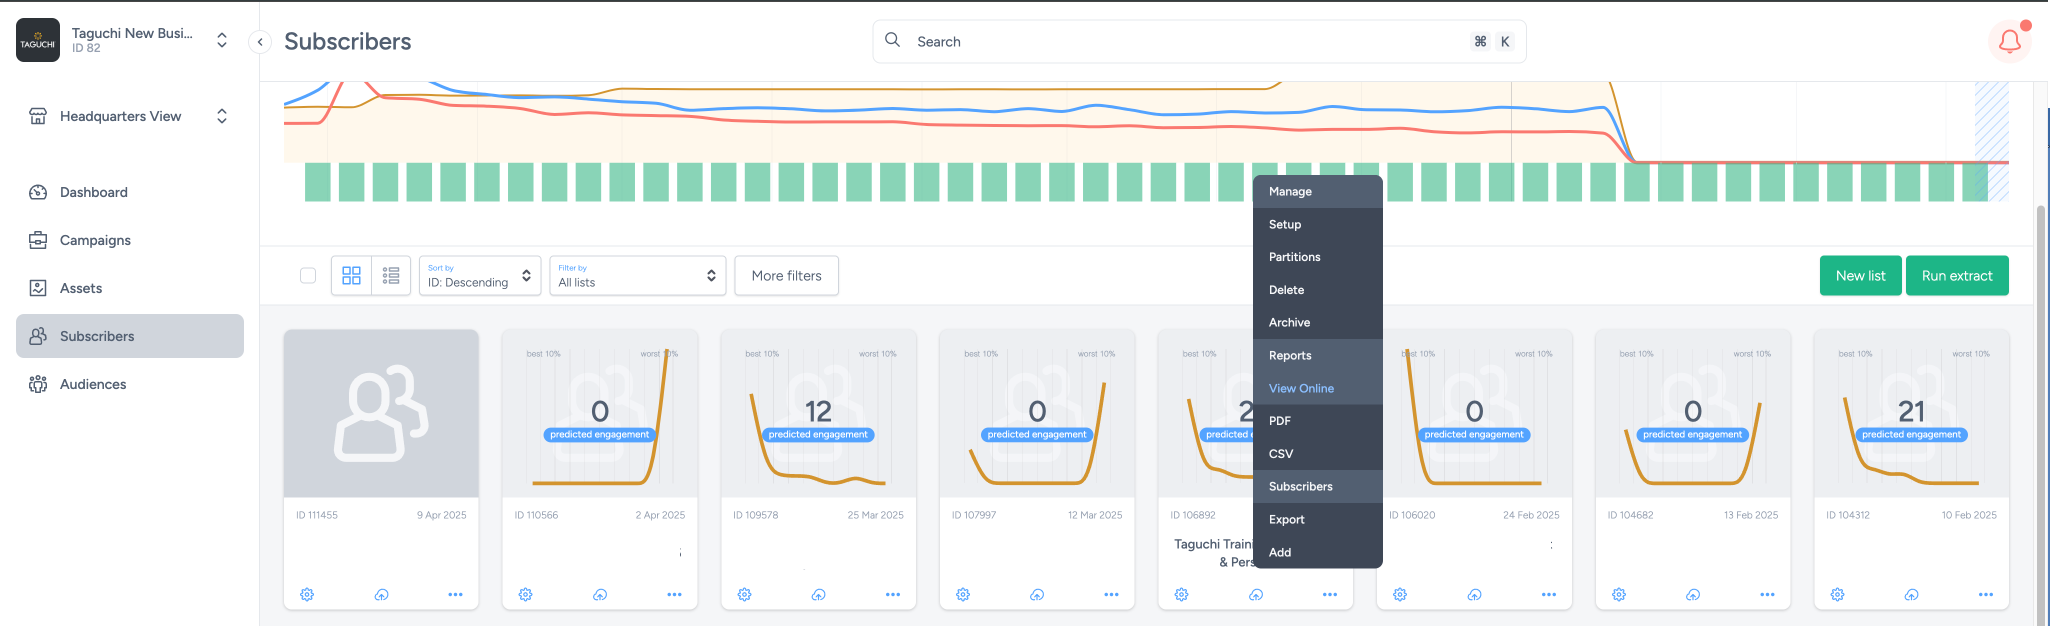
To view subscriber reports in Taguchi®, follow these steps:
- Navigate to your subscriber list.
- Click the ‘Actions’ gear icon located in the lower-right corner of the list tile.
- From the Actions tile, you can access a variety of subscriber list report options.
To analyse the source of your subscribers, scroll down to the Contactable subscribers by acquisition source section within your subscriber report.
This section provides a detailed breakdown of acquisition sources and highlights which methods have contributed most significantly to your subscriber list growth.
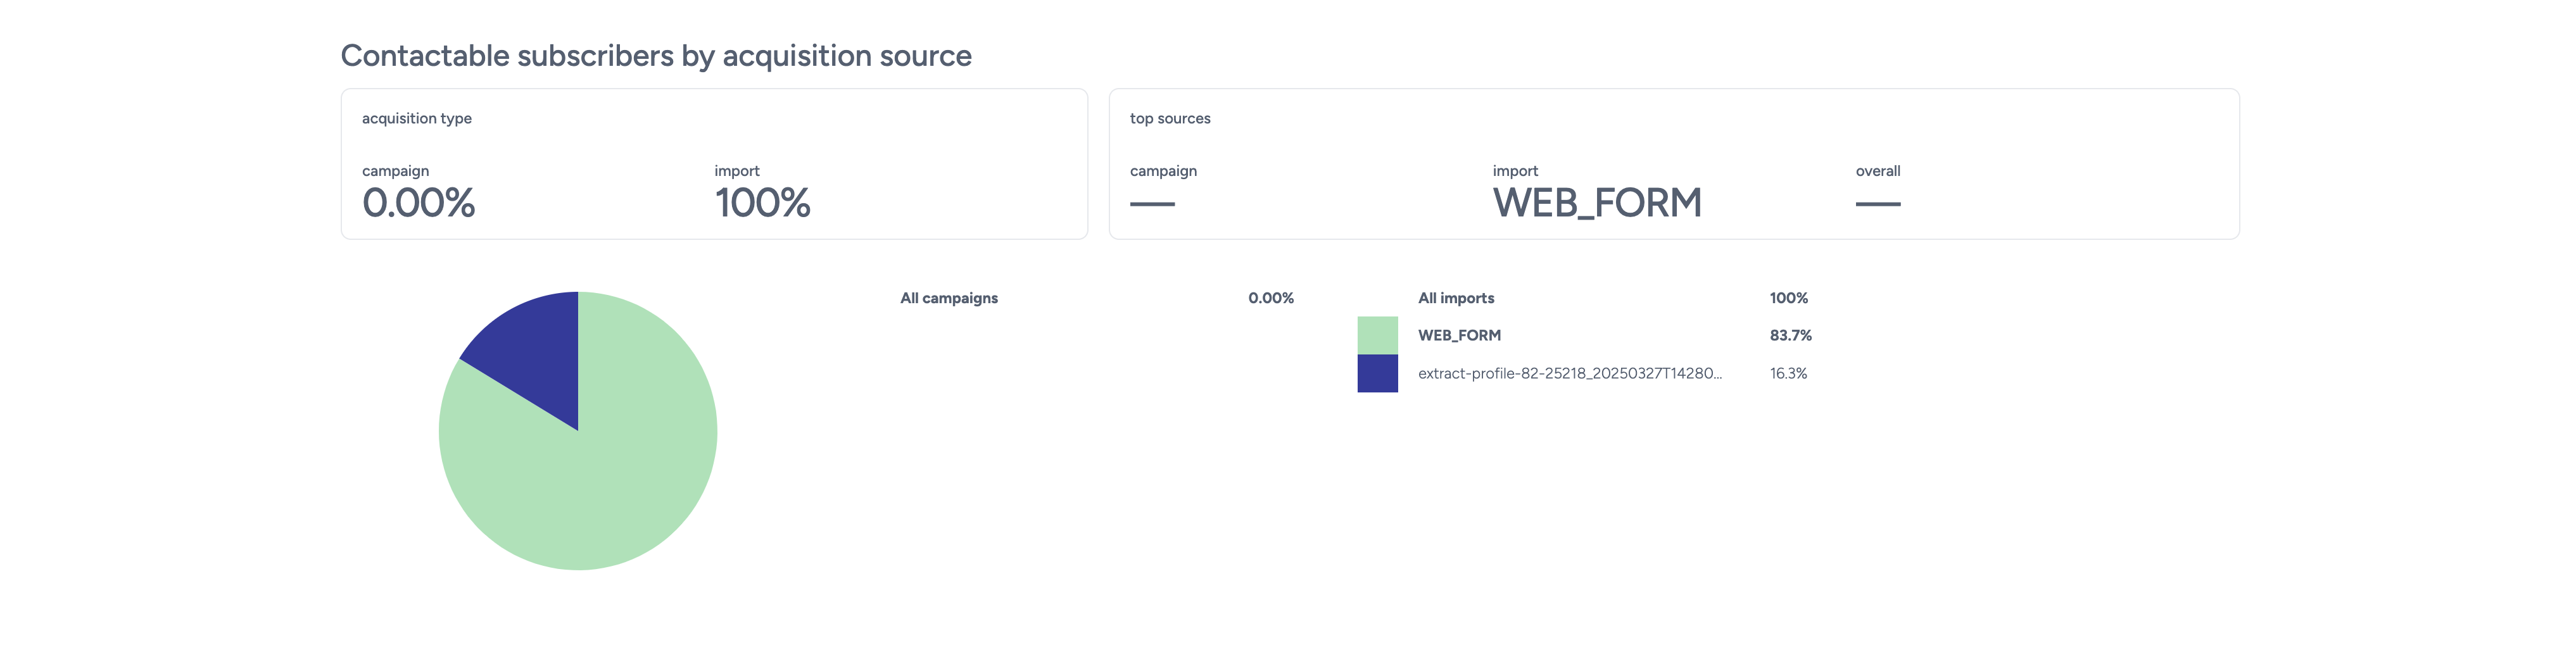
What you’ll see:
- Pie chart (left): A visual representation of the distribution of acquisition sources (e.g., imports, campaigns, webforms).
- Tables (right):
- By campaign: Displays subscribers acquired through webforms and marketing campaigns.
- By import files: Shows data from bulk file uploads and manual imports.
Above the graph:
- Acquisition types: Percentile breakdown of subscribers acquired via campaigns and import files.
- Top sources: Highlights the most impactful acquisition methods contributing to your list growth.
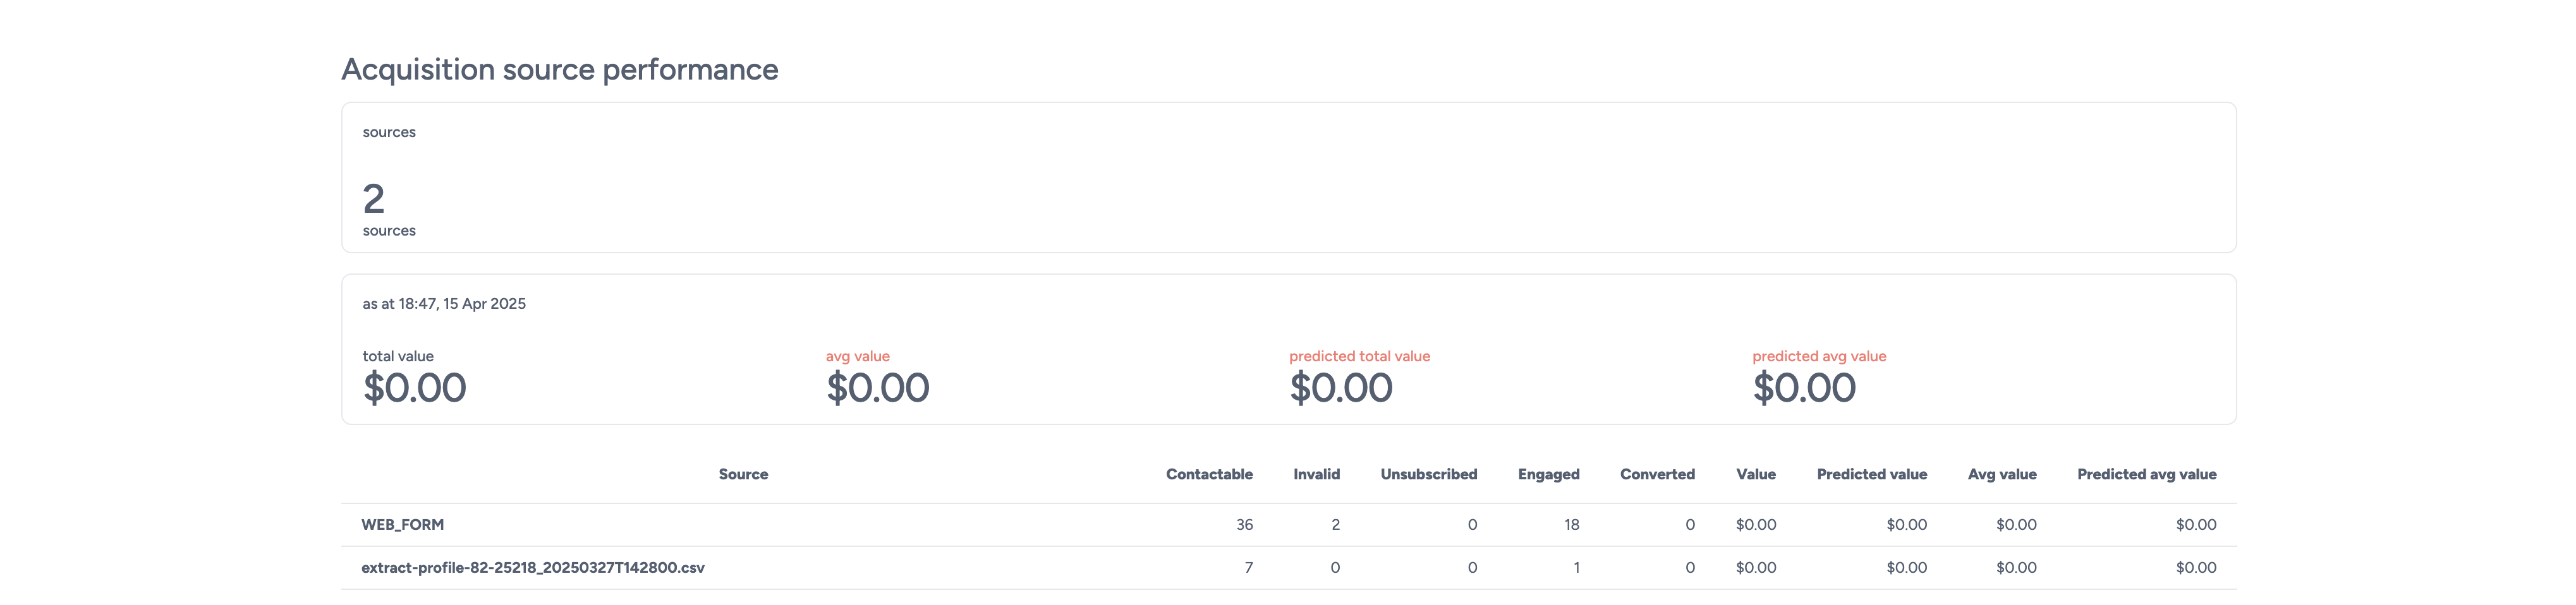
Acquisition source performance shows how each subscriber acquisition source has contributed to your list's effectiveness over time. This data is valuable for evaluating the quality and return on investment (ROI) of different subscriber sources.
Table overview
Each row in the table represents an individual acquisition source, with sortable and filterable columns including:
- Contactable
- The total number of subscribers from this source who have a valid and active email address or phone number.
- Invalid
- The number of subscribers from this source without a valid email address or phone number.
- Unsubscribed
- The number of subscribers from this source who have unsubscribed globally or from this specific list.
- Engaged
- The predicted number of opens, clicks, and page views expected from subscribers from this source over the next three years.
- Converted
- The total number of conversions generated by subscribers from this source.
- Value
- The total revenue or conversion value attributed to subscribers from this source.
- Predicted value
- The forecasted total value of future conversions from this source over the next three years, based on predicted conversion rates and average conversion values.
- Average value
- The average conversion value per subscriber from this acquisition source.
- Predicted average value
- The estimated average conversion value per subscriber over the next three years.
Metrics above the table Above the performance table, summary metrics are displayed to provide a high-level snapshot of list performance:
- Sources
- The total number of distinct acquisition sources contributing to the list.
- Total value
- The cumulative value of all conversions from subscribers on this list.
- Average value
- The average conversion value per subscriber on the list.
- Predicted total value
- The estimated total future conversion value from all subscribers over the next three years.
- Predicted average value
- The predicted average conversion value per subscriber over the next three years.
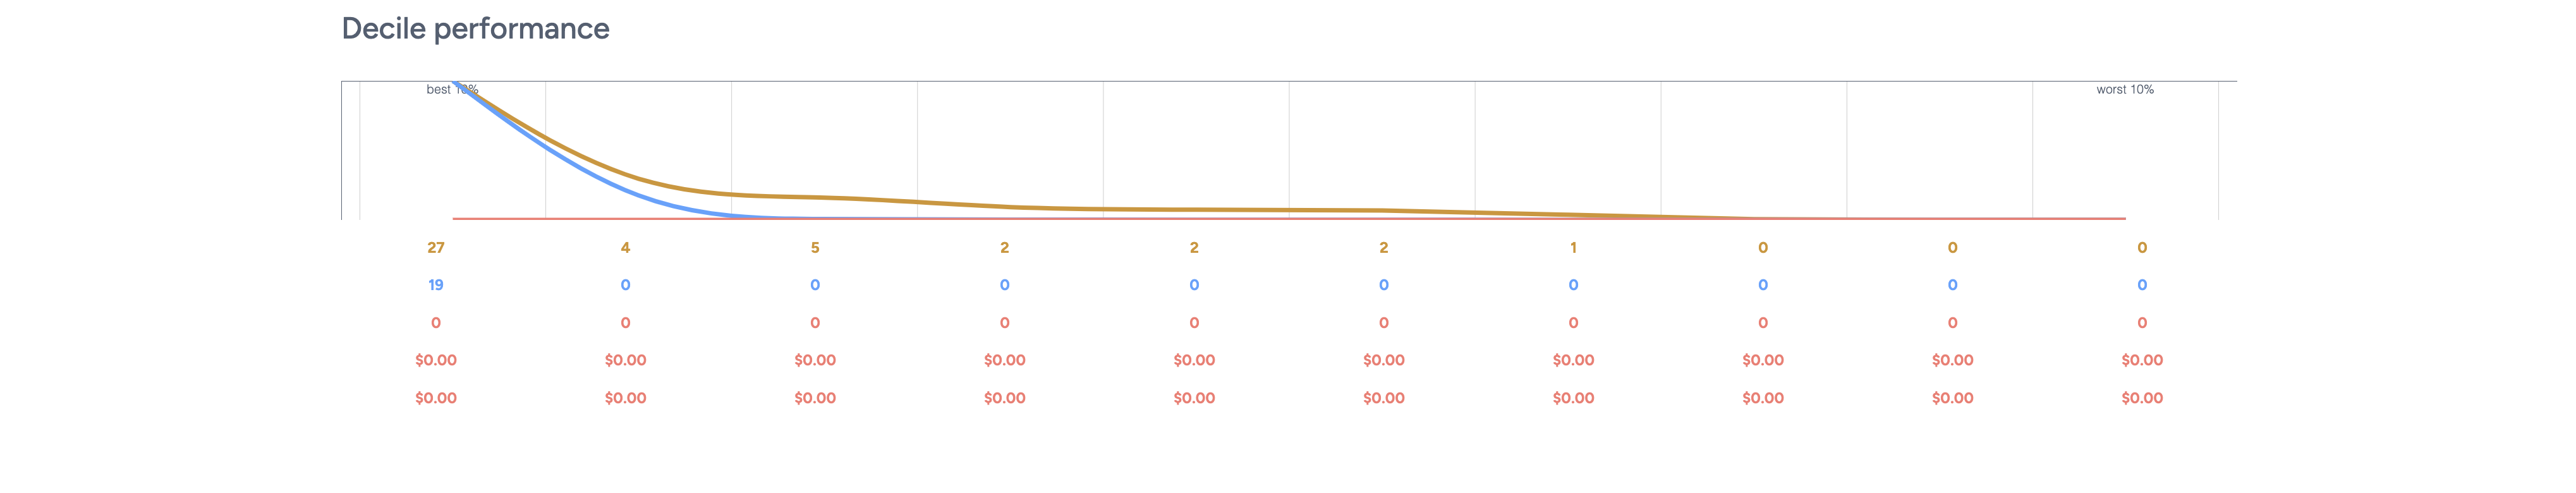
Decile performance
Decile performance section provides a visual breakdown of your subscriber list by engagement, segmented into ten equal deciles (10% groups). This allows you to assess the performance of your most and least engaged subscribers based on key metrics.
Each decile represents a 10% slice of the total contactable subscribers on the list, ordered from highest engagement (left) to lowest engagement (right).
What deciles represent
Deciles are determined based on performance indicators such as:
- Engagement metrics (e.g., opens, clicks, page views)
- Conversion metrics (e.g., conversions, value)
These metrics are visualised in a multi-line graph, allowing you to compare performance across all deciles.
Chart interpretation
The graph at the top shows how each decile performs across key engagement and conversion indicators.
The charts at the bottom further analyse combinations of performance across those deciles—displaying engagement and conversion trends among subscribers who received campaign sends.
Deciles are ordered left to right:
- Left = Top 10% of most engaged subscribers
- Right = Bottom 10% of least engaged subscribers
Decile performance row key
Each coloured row below the chart represents a specific performance metric for the corresponding decile:
- Row 1 (Yellow)
- Represents the number of contactable subscribers within each 10% segment.
- Row 2 (Blue)
- Displays the predicted future engagement (e.g., opens, clicks) for each decile.
- Row 3 (Red - Line 1)
- Shows the predicted future number of conversions from each decile.
- Row 4 (Red - Line 2)
- Indicates the predicted total conversion value from each decile.
- Row 5 (Red - Line 3)
- Reflects the predicted average conversion value per subscriber in each decile.
Contactable subscribers by acquisition source, Acquisition source performance and Decile performance are also all available when you download a PDF or CSV copy of the reports.